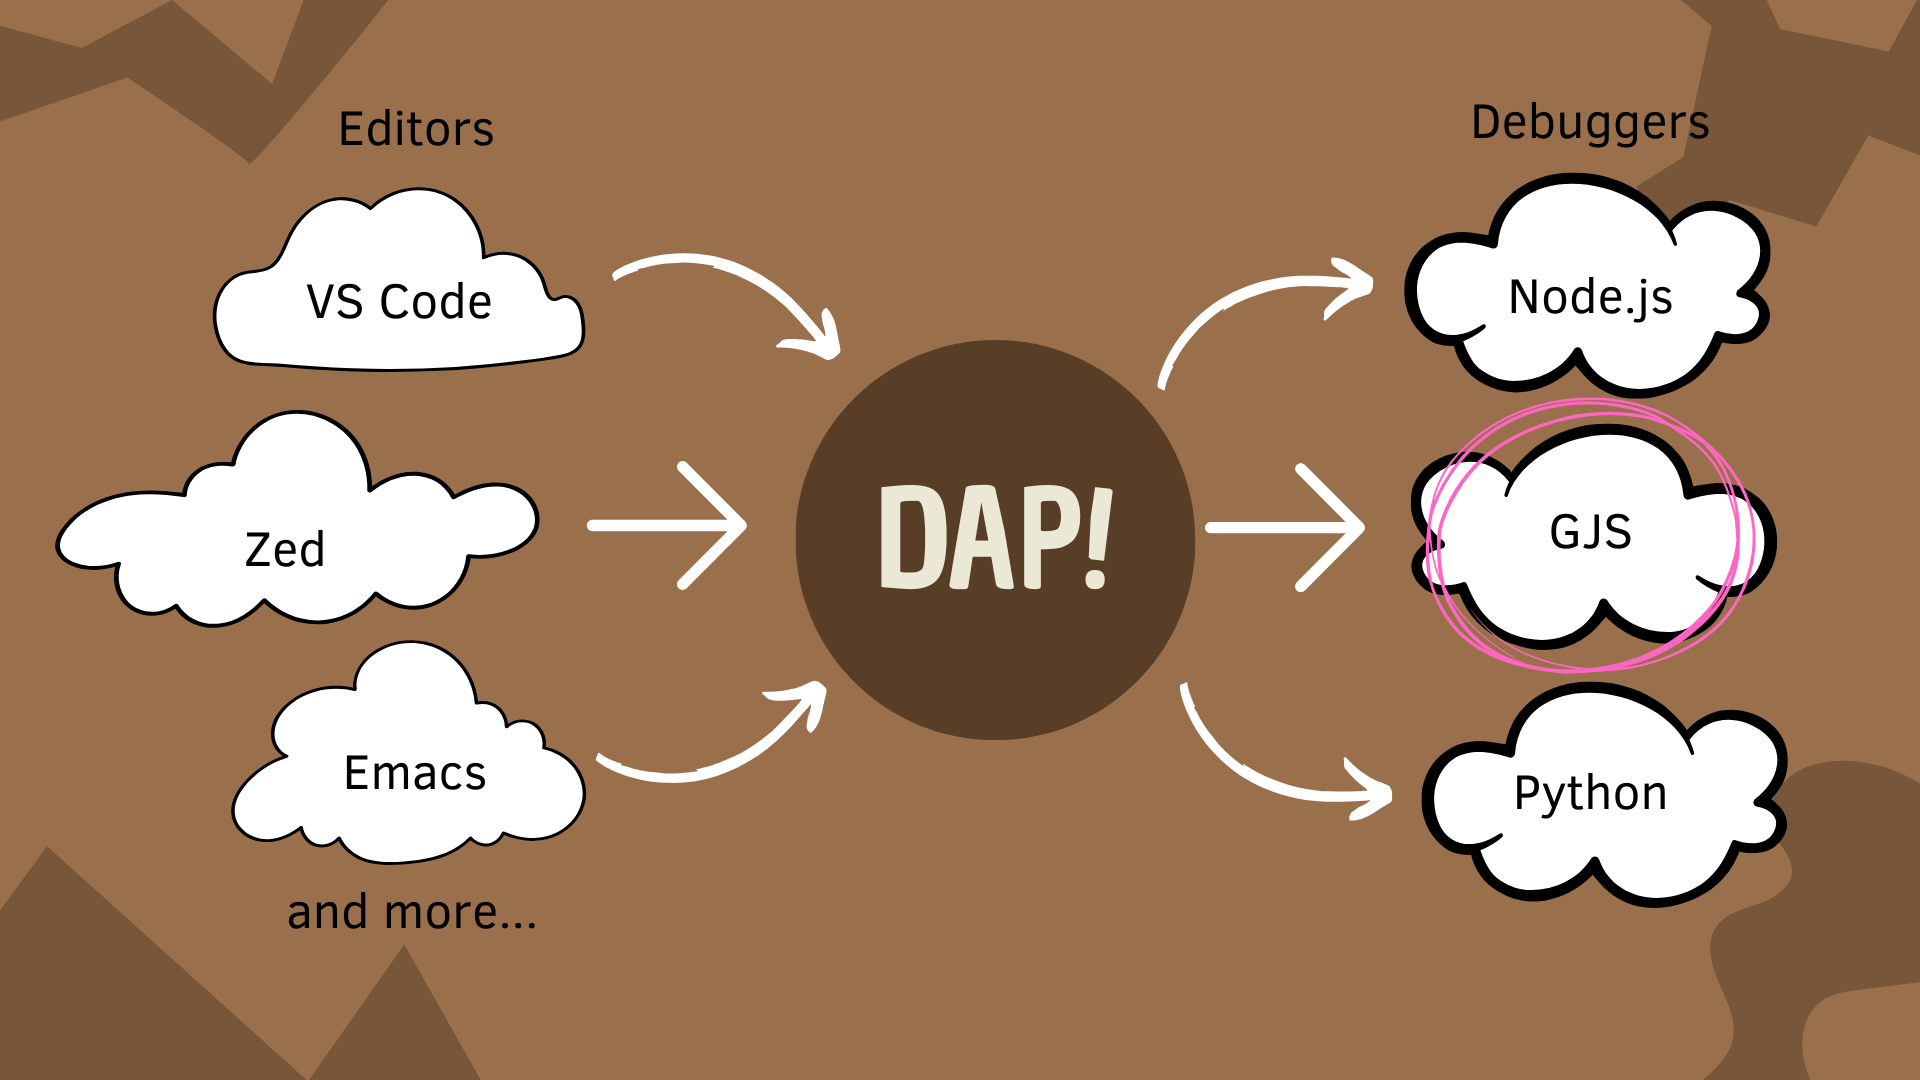
Hello! I’m Angelo Verlain, a Software Engineering student, and I’ve been working for the last 3 months easing the debugging process of GJS apps by adding Debug Adapter Protocol (DAP) support to GJS as part of Google Summer of Code (GSoC 2026).
A debugger is software for executing a computer program in an environment that allows for programming-level inspection and control. A debugger is often used to debug, but can be used for other goals including testing. Common features of a debugger include stepping through code line-by-line, breaking into the program’s flow of control, managing breakpoints, and reporting and modifying memory. 1
What is GJS?
GJS or GNOME JavaScript is a JavaScript interpreter that allows developers to write code that can leverage GLib/GObject and various other libraries that work with GObject Introspection like GTK, Libsoup, etc…
In practice, GJS allows you to write GNOME/GTK Applications and GNOME Components in JavaScript. The GNOME Shell & Extensions, GNOME Weather, GNOME Audio Player, GNOME Maps, Workbench are all examples of projects powered by GJS.
What is DAP?
The Debug Adapter Protocol is a a specification that describes how messages are passed between a debugger client (for example, your IDE) and server (such as the Node.js or any other language runtime). It specifies and communicates pausing & continuing execution, setting breakpoints, stepping through the code, viewing stack traces, and more. It works by defining a standard way for your development tool (e.g. GNOME Builder, VS Code, Zed, etc…) to connect to a debugger.
Today, you can already debug applications and libraries written for/with Android, Node.js, Deno, C, C++, Rust, Python and more. This project aims to make GJS applications debuggable in your favourite editor or debugger by implementing a DAP adapter for GJS.
Adding DAP to GJS
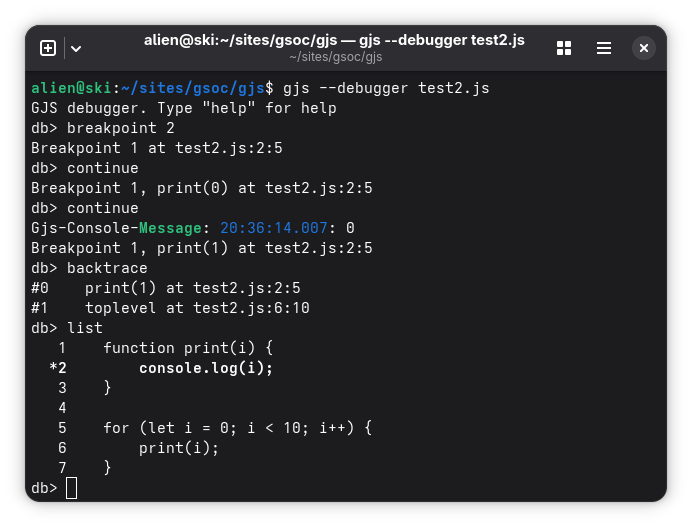
GJS already supports debugging programs by use of the --debugger flag, which spins up a GDB-style CLI interface where you invoke it by running gjs --debugger [file-name].js and writing commands like breakpoint [line], step, frame to set breakpoints, step through the code and print the stack frame respectively.
It works well, but it’s different from the GUI debugging that’s more popular these days.
Here’s an example of GJS debugging the following code saved as test2.js
function print(i) {
  console.log(i);
}

for (let i = 0; i < 10; i++) {
  print(i);
}
If GJS had support for DAP, you wouldn’t be limited to just using the text mode debugger, but could debug applications using your favourite editor (Zed, VS Code, etc…)
The workflow would be easier too: Press F5 to debug (standard hotkey), specify the path to your entrypoint, and then run the program. To set a breakpoint, simply type the debugger keyword or click in the gutter/margin of your editor (even after your program has started execution!).
When the program reaches that breakpoint, you will have a nice stack trace showing where the program stopped, and give you options to inspect the current variables in the different scopes, continue execution, or step next, in our out of frames.
Here’s an example of debugging the same script using VS Code’s Node.js adapter (the experience we want):
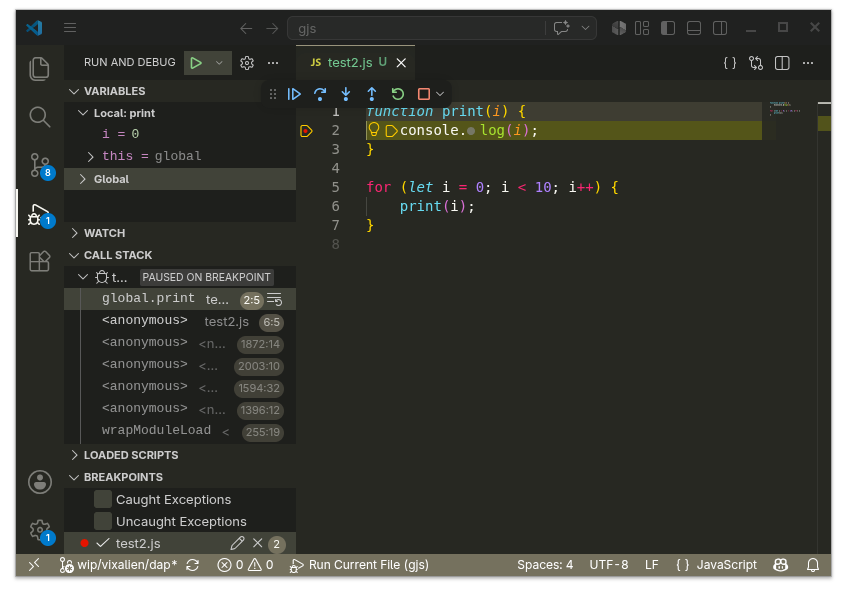
Note that you can more clearly see the variables, call stack and breakpoints in the debugger.
Scope
My work is focused on launching & debugging GJS apps.
The scope is also limited to launching & debugging GJS applications or running scripts in the GJS interpreter and debugging them. Attaching to already running applications is not in scope.
Concretely this also means that debugging components like the GNOME Shell is not in scope.
Furthermore, I have only written an extension for Zed since it’s the editor I use, but other editor extensions like VS Code, Builder, and Emacs could be implemented as a follow-up task and will be relatively easy since GJS itself implements the DAP specification and we just need to bridge the two. If you want support for a specific editor or debugger, please let me know :).
Progress
I’ve made significant progress on the project.
The project period is coming to a close and I’ve made significant progress. Currently, the following is implement:
- A work-in-progress GJS DAP Extension is implemented, which allows you to debug GJS applications inside the Zed Editor. It’s not yet published to the Zed Extension Store though
- You are able to launch a GJS program or run a file and break on entry
- Automatically pausing on debugger statements
- Ability to add breakpoints by clicking in the gutter/margin of the code editor (even while the app is running!)
- When execution pauses, you are able to resume execution to the next statement, or step in/out of functions/methods/scopes.
- When execution pauses, you can see all the stack frames
- When execution is paused, you can also inspect the different scopes and the variables defined in all of the scopes
My next steps will focus on the following:
- Implement a VS Code Extension so you can also debug GJS applications in VS Code in addition to Zed
- Allow configuring breaking on Caught and Uncaught exceptions
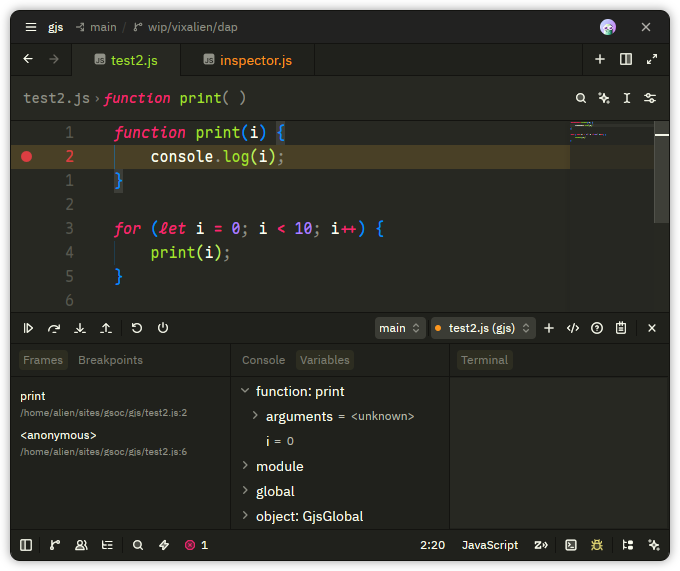
Figure: Debugging a program with a visual debugger (Zed), showing breakpoints (red circle in the gutter), current line highlighted and variables
I’m looking forward to sharing my progress when we get to the end of the program! Expect another blog post in the next couple of weeks.